PP vs PET for Food and Beverage Packaging: A Procurement Manager’s Decision Guide
If you’re sourcing plastic containers — bottles, jars, cans, or cups — you’ve almost certainly narrowed the field to two materials: PP and PET. Together they account for over $46 billion in global packaging revenue, and for good reason. Each dominates specific applications and each brings a distinct set of trade-offs to the table.
But here’s the problem with most PP vs PET comparisons: they tell you that PET is clearer and PP handles heat better, then stop. What they don’t tell you is what those differences actually cost you — in shelf life, in compliance risk, in freight charges, or in the phone call you’ll have to make when your customer asks for a certificate you don’t have.
This guide walks through the six dimensions that drive real procurement decisions, maps each material to actual product types, and gives you a framework for evaluating whichever manufacturer you end up choosing.
What PP and PET Bring to the Table
Before comparing them head-to-head, it helps to understand what these two materials actually are at the polymer level — because their molecular structure dictates every performance difference that follows.
PP (Polypropylene) belongs to the polyolefin family, alongside polyethylene. It is the lightest commercial thermoplastic, with a density of just 0.89–0.91 g/cm³. That low density is not a minor spec — 1 kg of PP resin produces roughly 161 standard containers, versus about 109 from the same weight of PET. PP melts at around 160–170°C, which gives it the heat resistance that defines its role in hot-fill and microwaveable packaging.
PET (Polyethylene Terephthalate) is a polyester, structurally related to PBT. With a density of 1.38–1.41 g/cm³, it’s about 31% heavier than PP per unit volume. PET melts much higher — around 250°C — but its glass transition temperature (the point where it begins to soften) sits at just ~70°C. This is the critical distinction: PET flows at a high temperature during processing, but loses structural integrity at temperatures as low as 75°C in use. That single fact explains why you never see a PET container in a microwave.
In revenue terms, PET packaging commanded an estimated $31.82 billion globally in 2024, compared to $15.12 billion for PP, with both growing at roughly 6.5% annually. PET dominates beverage bottles and clear food jars; PP leads in hot-food containers, dairy cups, and closures. Neither is replacing the other — their application territories are largely complementary.
Performance Face-Off — The Six Dimensions That Matter
The table below gives you a 30-second snapshot. But the details in each dimension are where procurement decisions get made or broken. Read past the table — the three sections that follow explain the “why” and, more importantly, when the conventional wisdom flips.
| Dimension | PP | PET | Impact on Procurement | Common Failure Mode |
|---|---|---|---|---|
| Density | 0.89–0.91 g/cm³ | 1.38–1.41 g/cm³ | Affects freight cost, per-unit material usage | Overlooking weight savings in shipping TCO |
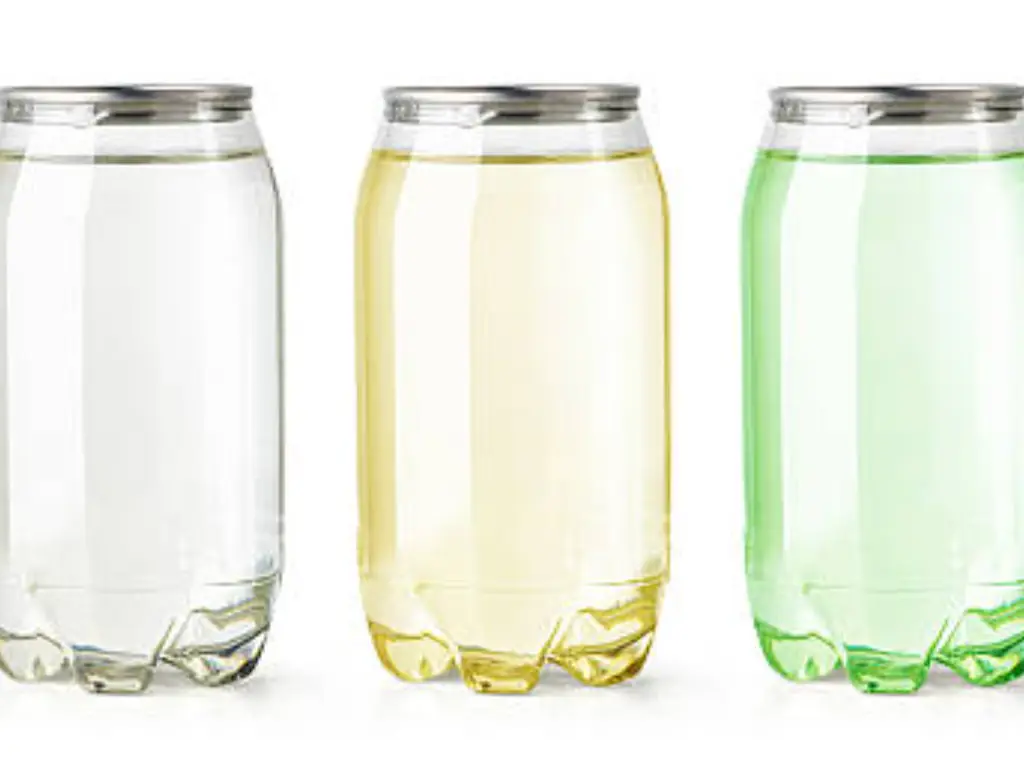
| Clarity | Translucent (can be clarified) | Crystal clear (haze <10%) | Shelf appeal, consumer purchase intent | Assuming PP can’t be clear (it can, at a cost) |
| Heat Resistance | 100–130°C (microwave safe) | Softens above ~70°C | Hot-fill, microwave, sterilization | PET container collapse in warm warehouse |
| Oxygen Barrier | Poor (OTR: 50–100 cc·mil/100 in²·day·atm) | Excellent (OTR: 3–6) | Shelf life for oxygen-sensitive products | 50% shelf-life loss when switching PET → PP |
| Moisture Barrier | Excellent (WVTR: 0.3–0.5) | Moderate (WVTR: 1.5–2.5) | Dry product protection, humidity resistance | Moisture ingress in PET-packaged dry powders |
| Impact Strength | High ductility (elongation 100–600%) | Medium rigidity (elongation 30–70%) | Stacking, transport, drop survival | PP creep under sustained top-load; PET brittleness in cold |
Clarity and Shelf Appeal — Seeing Is Selling
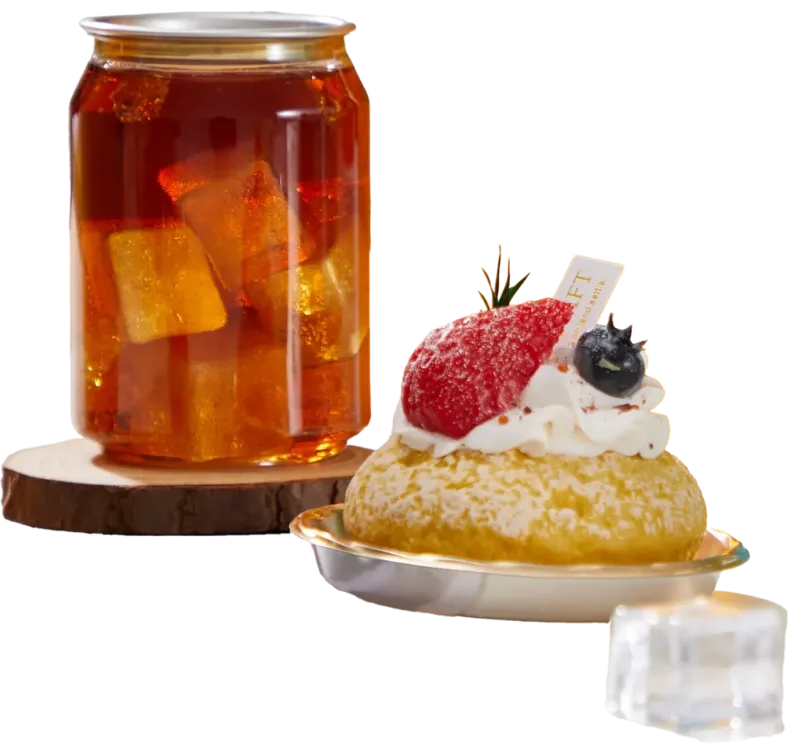
PET owes its glass-like clarity to its molecular structure. In its amorphous state — achieved by rapid cooling from the melt — PET allows light to pass through with minimal scattering, producing haze values below 10% as measured by ASTM D1003. This is why a PET jar of honey or a PET bottle of juice looks brilliant on the shelf: the product inside does the selling.
PP, by contrast, is semi-crystalline at room temperature regardless of cooling rate. Its natural state is translucent to milky, with haze values typically exceeding 30%. For functional containers like yogurt cups or takeout lids, this is perfectly acceptable. But for a premium nut mix or a vibrant juice blend where visual appeal drives purchase decisions, unmodified PP falls short.
That said, the “PP can’t be clear” assumption is outdated. Clarifying agents like Milliken’s Millad NX 8000 can reduce PP haze to 8–12%, approaching PET-level clarity. The catch: clarified PP resin costs 10–15% more than standard PP, partially eroding PP’s raw cost advantage. For shelf-stable dry snacks that don’t need heat resistance, the cost of clarifying PP rarely makes sense versus simply using PET. But for a hot-filled product that must also look good on shelf — a premium pasta sauce, for instance — clarified PP is the only material that can do both.
The practical rule: if your product sells primarily on visual appeal at ambient temperature, PET is the default. If it needs heat resistance and reasonable clarity, clarified PP exists as a viable — but more expensive — option.
Heat Resistance and Barrier Properties — The Hidden Performance Layer
Most procurement conversations start with transparency. But most product failures start with temperature and barrier — the two properties you can’t see but cannot afford to ignore.
Heat. PP’s continuous service temperature of 100–130°C makes it the undisputed choice for hot-fill applications (sauces, jams, soups filled at 85°C+), microwaveable containers, and steam-sterilizable packaging. PET’s glass transition at ~70°C means any sustained exposure above that threshold causes deformation — a PET jar on a sun-exposed loading dock in Shenzhen in August can soften and lose its shape before it ever reaches the port.
Oxygen barrier. This is PET’s killer advantage. PET’s oxygen transmission rate (OTR) of 3–6 cc·mil/(100 in²·day·atm) is roughly 10 to 20 times lower than PP’s 50–100. For products where oxidation matters — carbonated beverages (CO₂ retention), nut mixes (rancidity), cooking oils, dried fruit — PET is not just better; PP is often disqualifying. A carbonated drink in a PP container will go flat within weeks, because CO₂ molecules are small enough to slip through PP’s polymer chains.
Moisture barrier. The tables turn here. PP, as a non-polar polymer, naturally repels water, with a water vapor transmission rate (WVTR) of just 0.3–0.5 g·mil/(100 in²·day). PET’s WVTR is 1.5–2.5 — about 3 to 5 times higher. For dry products like protein powder, milk powder, or crunchy snacks, PP’s moisture resistance directly translates to longer shelf life and fewer customer complaints about clumping.
The takeaway: if your product’s failure mode is oxidation or carbonation loss, PET wins. If it’s moisture ingress or heat deformation, PP wins. There is no single-polymer solution that excels at both — multilayer structures exist, but they complicate recyclability and add cost.
Mechanical Strength and Logistics Durability — Surviving the Journey
Your packaging doesn’t retire after the product photo shoot. It gets stacked six high in a 40-foot container, vibrated across the Pacific for 30 days, and dropped on a warehouse floor at 2 a.m. by a tired forklift operator. How PP and PET handle this abuse differs in ways that affect your landed cost.
PP is the ductile survivor. Its elongation at break of 100–600% means it bends rather than cracks under impact. Repeated flexing — as happens during transport vibration — is well tolerated. However, PP has a weakness: creep. Under sustained compressive load (like being at the bottom of a tall pallet stack), PP slowly deforms over time. A PP container at the bottom of a 2-meter stack in a 50°C container may show visible compression marks after a month at sea.
PET is stiffer and more creep-resistant — better for tall stacking — but its elongation at break of only 30–70% means it’s more likely to crack under sudden impact. PET also performs better in cold: it retains toughness down to -40°C, making it the default for frozen food packaging. PP becomes brittle below 0°C, a liability for products destined for cold-chain distribution.
Then there’s the freight math. Because PP is 31% less dense than PET, a shipping container filled with PP containers holds approximately 30% more units by count than the same container filled with PET equivalents. On a China-to-US-West-Coast route where a 40HQ currently runs $2,500–4,500, that weight advantage can save $0.01–0.03 per unit in ocean freight alone. Over a million units, that’s $10,000–30,000 — real money that never appears on a unit price quote.
PP wins heat & moisture; PET wins clarity & oxygen. No single polymer excels at both — choose by product, not by material loyalty.
Food Safety and Compliance — What Your Certifier Will Check
Here is where most online comparisons go vague: “Both PP and PET are food-grade.” True, but useless. Being “food-grade” in the abstract does not satisfy a customs officer at the Port of Long Beach who wants to see a product-specific migration test report. Compliance is not a material property — it’s a documentation chain. Material choice, manufacturing process, migration testing, and batch traceability are four separate links. If any one breaks, your shipment sits in port accruing demurrage fees at $100–300 per day.
FDA and North American Requirements
Both PP and PET have clear regulatory pathways under the U.S. Food and Drug Administration’s food contact framework. PP is governed by 21 CFR §177.1520, which covers olefin polymers and sets specifications for density, melting point, and extractables limits that differ between homopolymer and copolymer grades. PET falls under 21 CFR §177.1630, which defines permissible starting substances and end-test parameters for polyester polymers in food contact.
The critical procurement difference lies not in the regulations themselves, but in recycled-content approval. rPET (recycled PET) has an established FDA clearance pathway through the agency’s No-Action Letter mechanism — numerous rPET producers have received letters confirming their recycled material is suitable for food contact. This is why you see “made with 30% recycled PET” on supermarket shelves. PP’s recycled-content pathway for food contact is less developed, with fewer approved suppliers and a more complex approval process. If your brand’s sustainability claims depend on post-consumer recycled content, PET currently has the regulatory head start in North America.
What to demand from your supplier for North American-bound products:
- Product-specific migration test reports (not a generic “FDA approved” statement — that covers the resin only, not the finished container)
- ISO 9001:2015 certification plus a food safety system certification — FSSC22000 v6.0 or BRCGS Packaging Issue 6
- Batch-level traceability documentation that links each production lot to raw material certificates and test results
A common pitfall: suppliers who provide a resin manufacturer’s FDA compliance letter and present it as product-level certification. The resin may be compliant, but if the manufacturing process introduces contaminants — from mold release agents, recycled regrind, or cross-contamination on shared lines — the finished container is not automatically covered.
EU and International Standards
European requirements are more stringent than FDA in several respects, and the regulatory landscape is actively tightening. EU Regulation 10/2011 on plastic food contact materials establishes an Overall Migration Limit (OML) of ≤10 mg/dm², plus a positive list of authorized substances with Specific Migration Limits (SMLs) for individual compounds. Both PP and PET can comply, but the documentation burden is heavier than for FDA.
For the European market, the certification stack typically requires:
- EU 10/2011 Declaration of Compliance (DoC) — product-specific
- REACH SVHC declaration confirming absence of Substances of Very High Concern (candidate list currently ~240 substances)
- RoHS compliance for electrical/electronic-adjacent applications
- CE marking for any associated machinery (e.g., can sealing equipment)
The biggest regulatory development on the horizon is the EU Packaging and Packaging Waste Regulation (PPWR, Regulation 2025/40), which entered into force in February 2025. Its headline requirement: by January 1, 2030, all packaging placed on the EU market must be recyclable, and plastic packaging must contain a minimum of 55% recycled content. PPWR applies to both PP and PET, but its practical impact differs: PET’s established recycling infrastructure makes the 55% target more achievable in the near term, while PP will require faster infrastructure build-out to meet the same threshold.
For buyers exporting to multiple regions, the practical takeaway is this: maintain separate compliance packages per destination market rather than relying on a single “international standard” claim. A container that clears FDA may still face questions under EU 10/2011, and vice versa. Ask your supplier to confirm which specific regulations each certificate covers — and which it doesn’t.
Sustainability Reality Check — Beyond the Recycling Symbol
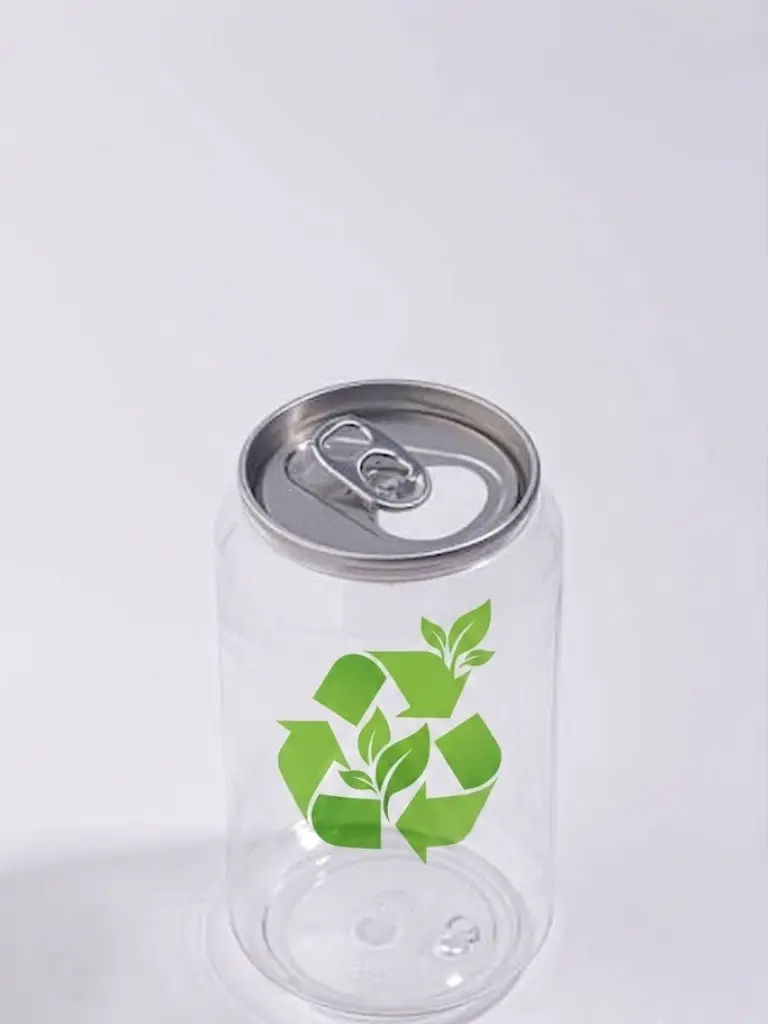
Every plastic container carries a resin identification code — ♳ for PET, ♷ for PP. The codes suggest recyclability. The infrastructure reality is more complicated, and the full environmental picture is not the one consumers assume.
Recyclability — Infrastructure Reality vs. Theoretical Potential
PET has the most mature plastic recycling infrastructure in the world. In the United States, 30.2% of PET bottles were collected for recycling in 2024, according to NAPCOR’s annual report — a slight decline from the 33.3% record set in 2023, but still above the 10-year average. In countries with deposit-return systems like Germany, PET collection rates exceed 90%. rPET is also the only recycled polymer with an established FDA food-contact approval pathway, creating a genuine bottle-to-bottle circular loop.
PP’s recycling numbers tell a different story. The overall recycling rate for rigid PP containers in the U.S. hovers around 8%, according to The Recycling Partnership. While PP bottles and jars are accepted at roughly 76% of U.S. community recycling programs, actual collection lags far behind acceptance, largely because consumers don’t consistently recycle PP items and sorting infrastructure is less optimized for PP than for PET.
However, the infrastructure gap is closing. Investment in PP recycling capacity has accelerated, with multiple new PP reclaimers coming online in 2024–2025 and chemical recycling technologies offering new pathways for PP waste streams that mechanical recycling cannot handle. If your product’s lifecycle is measured in years, not months, the PP recycling landscape in 2030 may look materially different from today’s.
Life Cycle Assessment — The Weight Advantage Nobody Talks About
When recycling infrastructure fails to capture a container, the container’s environmental impact is determined by its production footprint and what happens in landfill or incineration. Here, PP’s light weight flips the sustainability narrative.
A 2024 life cycle assessment commissioned by Milliken and conducted by Sphera compared PP and PET thermoformed trays across multiple environmental indicators. The finding: in landfilling and incineration scenarios, PP had a substantially lower environmental impact than virgin PET across global warming potential, acidification, eutrophication, water consumption, and cumulative energy demand. When both materials are recycled, their impacts converge.
The weight difference amplifies this advantage. Because PP is 31% less dense than PET, producing a PP container requires less raw material to begin with — and transporting it requires less fuel. Over a full supply chain, three truckloads of PP containers carry roughly the same unit count as four truckloads of PET equivalents.
None of this makes PP “greener” than PET in absolute terms. It means the answer depends on where your product is sold. In a German supermarket with a well-functioning Pfand system, PET’s recycling maturity gives it the edge. In a Southeast Asian market with limited recycling infrastructure, PP’s lower material intensity and lighter transport footprint may be the more defensible environmental choice. Brands that make blanket sustainability claims about one material over the other, without accounting for regional infrastructure, are telling an incomplete story.
The True Cost of Packaging — Beyond the Unit Price
Unit price is the most visible cost of packaging, and also the most misleading. Procurement managers who optimize for the per-piece quote alone often discover, months later, that they’ve paid more in freight, quality failures, and compliance delays than they ever saved on the invoice. A total cost of ownership framework surfaces what unit prices hide.
Visible Costs — Raw Material, Tooling, and Production
PP resin typically trades at $0.90–1.20/kg on the Chinese market, while bottle-grade PET resin runs $1.10–1.50/kg — a 10–20% premium driven by PET’s more energy-intensive polymerization process. For generic container shapes produced at high volume, this raw differential gives PP a head start.
Tooling costs widen the gap further. PP containers are typically produced via injection molding in a single step — melt the resin, inject into a mold, cool, eject. A single-cavity PP mold might cost $2,000–5,000. PET containers, by contrast, require a two-step process: injection mold the preform (a small, thick-walled tube with a finished neck), then reheat and blow-mold it into the final container shape. This requires two mold sets — one for the preform, one for the blow mold — with combined tooling costs of $5,000–15,000 or more per cavity set. For small to mid-volume production runs, this tooling amortization can dominate the per-unit cost.
Production cycle times also favor PP. A thin-wall PP container can cycle in 8–15 seconds per cavity. A PET container requires 15–25 seconds for preform injection plus 5–10 seconds for blow molding — roughly double the total cycle time. If your annual volume is in the millions, those extra seconds per unit compound into real capacity constraints.
Minimum order quantities reflect these cost structures. Light customization for PP containers — changing a label, a color, a cap style — can often start at 1,000 units. PET customization, because of the two-stage tooling, typically requires higher MOQs to amortize the upfront investment. This matters especially for startups and small brands testing a new product line who cannot yet commit to container volumes.
Hidden Costs — Freight, Quality Failure, and Compliance Risk
Three costs that never appear on a supplier quote but can each exceed the material savings of choosing the “cheaper” option:
Freight. If a PP container weighs 31% less than its PET equivalent, a 40HQ container from Shenzhen to Los Angeles carries roughly 30% more PP units. At current freight rates, that translates to $0.01–0.03 less per unit in ocean freight. Air freight — used for samples, rush orders, or premium products — amplifies this difference because air cargo is charged by weight, not volume.
Quality failure. A supplier with 95% yield produces 50,000 defective units for every million ordered. A supplier with 99.8% yield produces 2,000. That 4.8-percentage-point gap equals 48,000 containers you paid for but cannot use — plus the labor cost of sorting, the customer service cost of complaints, and the reputational cost of a retail partner who finds defects on shelf. At even $0.10 per unit, that’s $4,800 in direct waste per million — and the indirect costs are typically higher.
Compliance delays. A shipment held at U.S. Customs because of missing migration test documentation can accrue demurrage at $100–300 per day. Resolving a compliance query typically takes 2–4 weeks. For a food brand launching a seasonal product with a fixed retail window, a 3-week delay at port can mean missing the entire season — a cost measured in lost revenue, not fees.
The TCO lesson: the supplier who quotes $0.02 less per unit but ships at 95% yield with incomplete documentation will cost you more, almost every time, than the supplier who quotes a fair price and delivers 99.8% with a complete compliance package.
Which Material Fits Your Product? — The Decision Matrix
Everything we’ve covered distills to this: there is no universal winner. The right material is the one that matches your product’s chemistry, your fill-line temperature, your shelf-life target, and your customer’s expectations at the point of use. The table below maps common product types to their recommended material based on the six dimensions analyzed above.
| Product Type | Recommended Material | Key Reason | Exception / Watch-Out |
|---|---|---|---|
| Carbonated beverages | PET | CO₂ barrier — PP cannot retain carbonation | None; PET is the only viable single-polymer option |
| Hot-filled sauces & jams | PP | Fill temp 85°C+ — PET deforms | If shelf clarity is critical, use clarified PP |
| Nuts, dried fruit, snacks | PET | Oxygen barrier prevents rancidity; clarity sells the product | If hot-filled or microwaveable, switch to PP |
| Protein powder / milk powder | PP | Superior moisture barrier; lightweight reduces freight | If premium transparency matters, PET is an option |
| Yogurt & dairy cups | PP | Microwave-safe; excellent chemical resistance to acids | Cold-chain-only yogurt can use PET if desired |
| Cooking oils | PET | Oxygen barrier + clarity = premium shelf presence | PP acceptable for opaque bottles if cost-driven |
| Supplements & vitamins | Either | Both work; choice depends on moisture sensitivity and shelf positioning | PET for transparency, PP for moisture-sensitive powders |
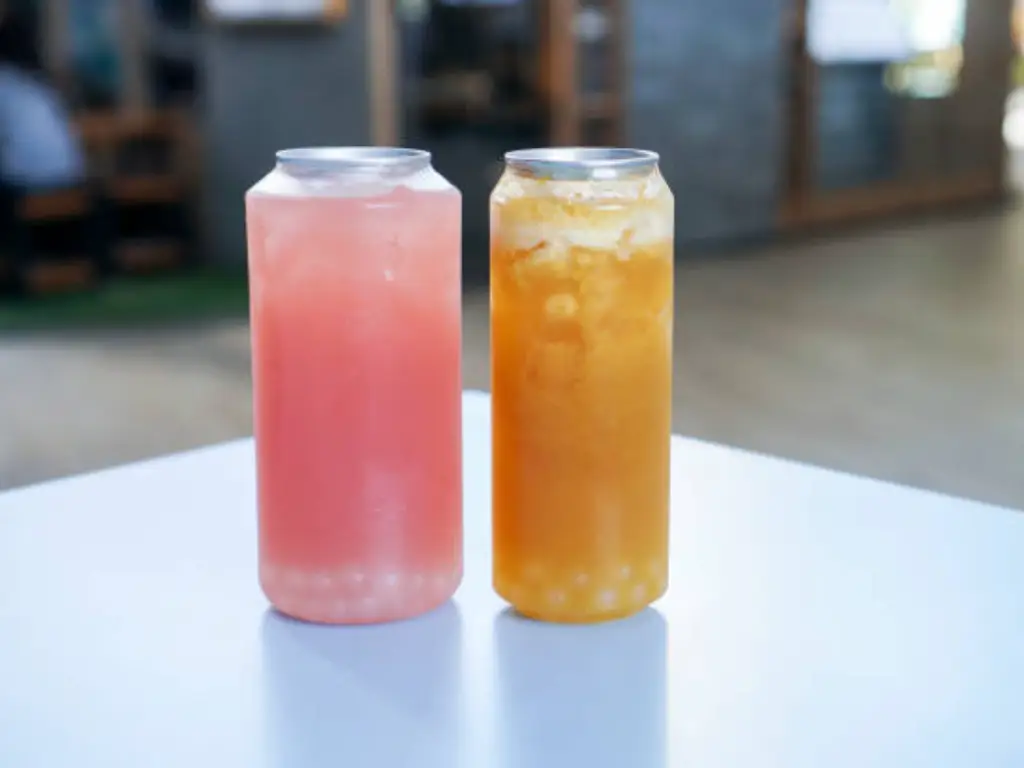
| Milk tea / boba cups | PP | Heat resistance for hot drinks; impact resistance for stacking | PET preferred for cold-only iced tea; PLA for eco claims |
| Frozen food trays | PET | Retains toughness at -40°C; PP becomes brittle | PP acceptable if product is microwaved directly from frozen |
Three cautionary notes if you’re considering switching an existing product from one material to the other:
- PET → PP: Test shelf life immediately. The oxygen barrier drop means your product may oxidize faster. Run accelerated aging tests (40°C / 75% RH for 3 months minimum) before committing.
- PP → PET: Verify your fill-line temperature. If you hot-fill at anything above 70°C, PET will deform. You may need to redesign your filling process or accept a lower fill temperature.
- Either direction: Run compatibility testing with your actual product — not just water. Oils, acids, and alcohols interact with polymer surfaces in ways that lab-grade simulants don’t always predict.
Regardless of which material you choose, you’re going to need a manufacturer who can execute on both the technical requirements and the customization specifics of your product. The best-positioned suppliers are those who work with both PP and PET rather than specializing in just one — a single-material specialist has an inherent bias toward recommending the material they happen to run, which may not be the right one for your product. Manufacturers like Foshan Outstanding Pack, who operate 14 injection molding lines and 14 blow molding lines for both PP and PET containers, can offer material-agnostic guidance based on your product’s actual requirements. Their customization scope covers 12 categories — from shape and capacity (150ML to 5L) to cap type, sealing method, and printing process — with light-customization samples delivered in 48 hours and MOQs as low as 1,000 units for non-mold projects. When a supplier can show you PP and PET options side by side, with sample quality you can inspect before committing to tooling, the material decision becomes empirical rather than theoretical.
- PET → PP: Test shelf life immediately. Run accelerated aging tests (40°C / 75% RH for 3 months minimum) before committing.
- PP → PET: Verify your fill-line temperature. If you hot-fill at anything above 70°C, PET will deform.
- Either direction: Run compatibility testing with your actual product — not just water. Oils, acids, and alcohols interact with polymer surfaces in ways that lab-grade simulants don’t always predict.
From Material Choice to Manufacturer Selection — What to Demand
You’ve settled on a material. Now you need a manufacturer who can deliver containers that match the specification — consistently, compliantly, and on time. The following framework separates the suppliers worth shortlisting from the ones you should walk away from, regardless of their unit price.
Certifications and Quality Systems — The Non-Negotiables
Before you ask about price, confirm the certification baseline. For food-contact packaging destined for international markets, a manufacturer should hold at minimum:
- ISO 9001:2015 — the floor for any organized quality management system
- FSSC22000 v6.0 or BRCGS Packaging Issue 6 — a food safety management system specific to packaging manufacturing; ISO 9001 alone is not sufficient for food contact
- Product-level FDA 21 CFR compliance documentation (for the U.S.) or EU 10/2011 Declaration of Compliance (for Europe) — not a generic resin certificate, but a product-specific migration test report from a recognized third-party lab like SGS, Intertek, TÜV Rheinland, or Bureau Veritas
- GMP certification — for pharmaceutical or supplement packaging, a 100,000-class or higher cleanroom certification is the standard expectation
If a supplier cannot produce at least three of these four within 24 hours of your request, that is a red flag independent of price. A competitive quote means nothing if the shipment gets held at the destination port for lack of documentation.
Additional certifications — CE marking for machinery, REACH SVHC declarations, Sedex membership for ethical sourcing, RoHS compliance — become relevant depending on your product category and destination market. But the four above are the universal baseline.
Production Capability and Service — What Separates the Best from the Rest
Certifications prove a supplier can produce compliant packaging. Production capability determines whether they can produce yours, at your volume, with your quality expectations, on your timeline. Six dimensions to evaluate beyond the certificate folder:
Raw material integrity. Ask which resin brand the manufacturer uses and whether they can provide batch-level traceability from resin lot to finished container. A supplier who uses branded virgin resin — CRCCHEM (Huarun Chemical) PET, for instance, is widely recognized in international markets — and can show raw material certificates for each production batch is fundamentally different from one who blends from multiple sources or introduces recycled content without disclosure. For food-grade packaging, “100% virgin” should be verifiable, not just claimed.
Production scale. Match the manufacturer’s capacity to your volume. A factory with 14 injection molding machines and 14 blow molding machines operating in a 30,000 m² facility can handle multi-million-unit annual orders without subcontracting. A two-machine shop quoting the same volume will either delay delivery or quietly outsource portions of your order to facilities you haven’t vetted. Ask for machine count, daily output capacity, and — if possible — a factory video walkthrough.
Yield rate. The industry benchmark for quality packaging manufacturers is 99.5% or higher. Top performers operate at 99.8% — meaning just 2 defective units per 1,000 produced, verified through 100% visual inspection plus laboratory sampling for dimensional accuracy, seal integrity, and drop testing. Ask the supplier to state their yield rate as a specific number and whether they’ll commit to it contractually. A supplier who says “we don’t track that” or gives you a vague “very high quality” response is not managing quality systematically.
Sample turnaround. For light customization — your logo on an existing mold, a color change, a cap swap — 48-hour sample delivery is the mark of a well-organized operation. Longer than 5 days suggests internal bottlenecks that will also affect production lead times. For heavy customization requiring new molds, 15 days to first sample is reasonable; significantly longer may indicate reliance on external mold makers with their own queues.
In-house chain coverage. The ideal manufacturer handles injection molding, blow molding, printing (silk screen / labeling / heat transfer), and assembly under one roof. Each outsourced step introduces a coordination risk, a quality control gap, and a margin markup. A supplier who can show you the printing station next to the blow molding line, rather than referring to an unnamed “printing partner,” is operationally more integrated and accountable.
Problem resolution. Ask what happens when something goes wrong — because eventually, something will. How does the supplier handle a complaint about seal failure? What’s the protocol for containers deformed by container heat during ocean freight? The best manufacturers have standard operating procedures for these scenarios — a troubleshooting video for sealing issues, heat-reflective film added to packaging for tropical-route shipments, a documented corrective action process. If the answer to “what if” questions is vague reassurance rather than a specific process description, the supplier is betting on problems not happening rather than preparing for them.
The difference between a supplier who meets these six criteria and one who doesn’t is not marginal — it’s the difference between packaging that arrives on time with complete documentation, and packaging that generates problems faster than you can solve them. When you find a manufacturer whose certification portfolio spans ISO 9001, FSSC22000, BRCGS, FDA, EU 10/2011, and CE — with quarterly SGS batch testing to back each one — and whose yield, sample speed, and in-house chain coverage match the benchmarks above, you’ve found a partner, not just a vendor. Foshan Outstanding Pack, for example, maintains this full certification stack with 99.8% yield, 48-hour light-custom samples, and a 14-machine injection and blow molding operation running on 100% CRCCHEM virgin PET — the kind of profile worth comparing against when you evaluate your current or prospective packaging suppliers.
References
- NAPCOR. “2024 PET Recycling Report.” December 2025. https://napcor.com/news/2024-pet-recycling-report-press-release/
- FDA. “21 CFR Part 177 — Indirect Food Additives: Polymers.” U.S. Food and Drug Administration. https://www.accessdata.fda.gov/scripts/cdrh/cfdocs/cfcfr/CFRSearch.cfm?CFRPart=177
- European Commission. “Commission Regulation (EU) No 10/2011 on plastic materials and articles intended to come into contact with food.” https://eur-lex.europa.eu/legal-content/EN/TXT/?uri=CELEX:32011R0010
- European Commission. “Packaging and Packaging Waste Regulation (EU) 2025/40.” February 2025. https://eur-lex.europa.eu/legal-content/EN/TXT/?uri=CELEX:32025R0040
- Outstanding Pack. “Custom Services.” https://www.outstandingpack.com/custom-services/
- Outstanding Pack. “Certificates.” https://www.outstandingpack.com/certificates/
- Outstanding Pack. “Plastic Cans.” https://www.outstandingpack.com/plastic-cans/
- Outstanding Pack. “Plastic Jars.” https://www.outstandingpack.com/plastic-jars/
- Outstanding Pack. “Plastic Bottles.” https://www.outstandingpack.com/plastic-bottles/
- Outstanding Pack. “Contact.” https://www.outstandingpack.com/contact/
- Outstanding Pack. Homepage. https://www.outstandingpack.com/